Rethinking RAG for Visual Data: Building a Knowledge Graph with Agentic Visual Reasoning
Most AI agents today can read text — but when it comes to charts, diagrams, and slides, they're effectively blind.

Mateusz Gierlach
Co-Founder & CEO
Most AI agents today can read text — but when it comes to charts, diagrams, and slides, they're effectively blind.
Modern RAG systems work great for text, but they break down on visual data. Imagine you have 10,000 PDF slides full of charts and tables. You could run a visual extraction pipeline to parse everything, but you end up with millions of scattered data points in JSON files. How do you query that at scale? Standard vector search (Pinecone, Weaviate, etc.) just indexes embeddings and ignores chart structure and context. The key insight is: we need a structured index of facts, not isolated vectors.
How Polyvia Engine works
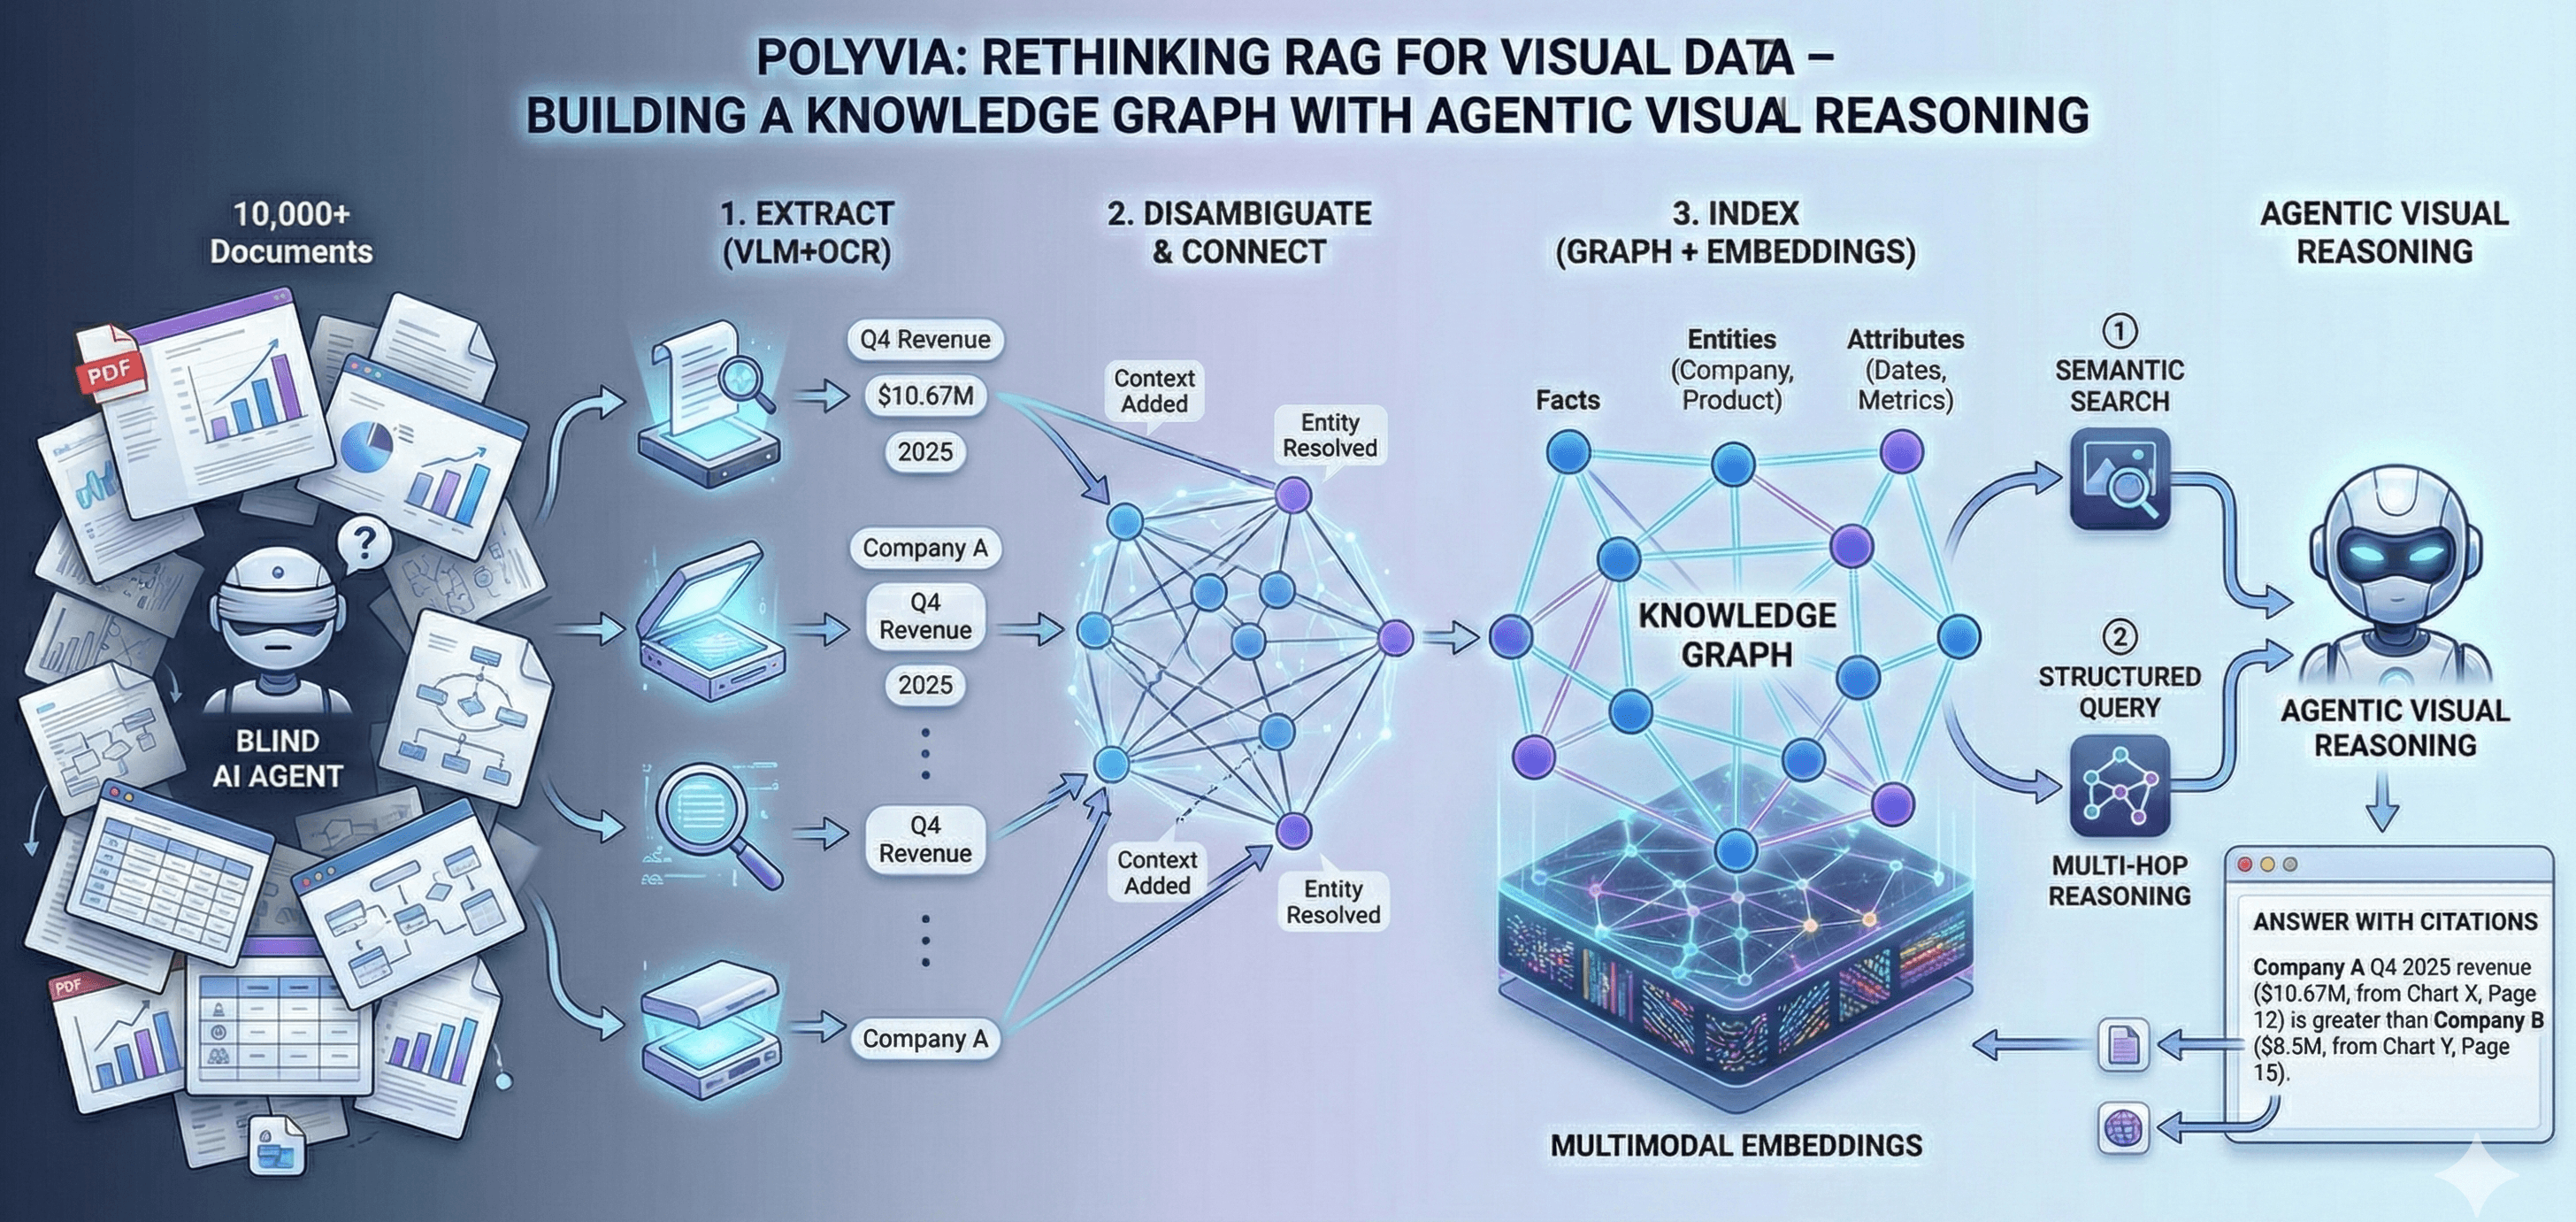
Polyvia Engine works in four main stages:
Extract (VLM+OCR)
We parse every page with state-of-the-art vision-language models and OCR, identifying charts, tables, diagrams and their elements (axes, labels, values). This recovers the raw data behind each visual.
Disambiguate & Connect
Each extracted fact (e.g. "Q4 2025 revenue: $10.67M") is tagged with context like entity name, time period, and source. We resolve duplicates and link related facts across pages (for example, recognizing that "Company A Q4 2025 revenue" on page 12 and page 15 are the same metric). This produces a knowledge graph of facts.
Index (Graph + Embeddings)
We build a hybrid index that stores these facts in a graph, along with multimodal embeddings. Facts are nodes connected to entities (companies, products) and attributes (dates, metrics). We also compute embeddings for infographics and visual elements to allow semantic search.
Query & Reason
AI agents can query this index in two ways: (1) a semantic search using vision/text embeddings to find relevant visuals, and (2) structured graph queries that hop through connected facts. In practice, the LLM driving the agent will call on both retrieval methods, enabling multi-hop reasoning. Each answer is grounded by pulling facts from the graph and citing their source charts.
Why this architecture matters
This architecture solves problems that current tools can't address. You get cross-document querying (e.g. comparing values from different reports) without writing custom parsers. You have one source of truth – if multiple charts say the same KPI, the graph deduplicates and unifies them. You achieve auditability: every answer comes with citations to the original doc/pages. Crucially, queries remain fast even on millions of documents, because we search an index rather than scanning all raw images.
In short, Polyvia is a new Visual RAG infrastructure layer. It offloads heavy extraction and indexing into a graph of facts, freeing your LLMs and agents to focus on reasoning. The result is accurate visual intelligence at scale.
Imagine having a solution where you can ask 'What was Company A's Q4 2025 revenue compared to Company B?' — and it instantly retrieves the relevant figures from multiple reports, computes the difference, and cites the exact charts and pages.
With Polyvia, organizations no longer need to manually sift through thousands of slides to find critical insights. By connecting facts across millions of visuals, we're enabling AI agents to truly reason over visual data — turning hidden charts into actionable intelligence.